02 / Selected case · Analytics · Integrations · Report builder
Many data sources.One reporting canvas.
A marketing intelligence workspace that connects data sources and turns them into configurable, reusable reports.
Two connected workflows
Connect the signal. Compose the story.
The product moves from authenticated data sources into a flexible report canvas. These films show the real flows, in that order.
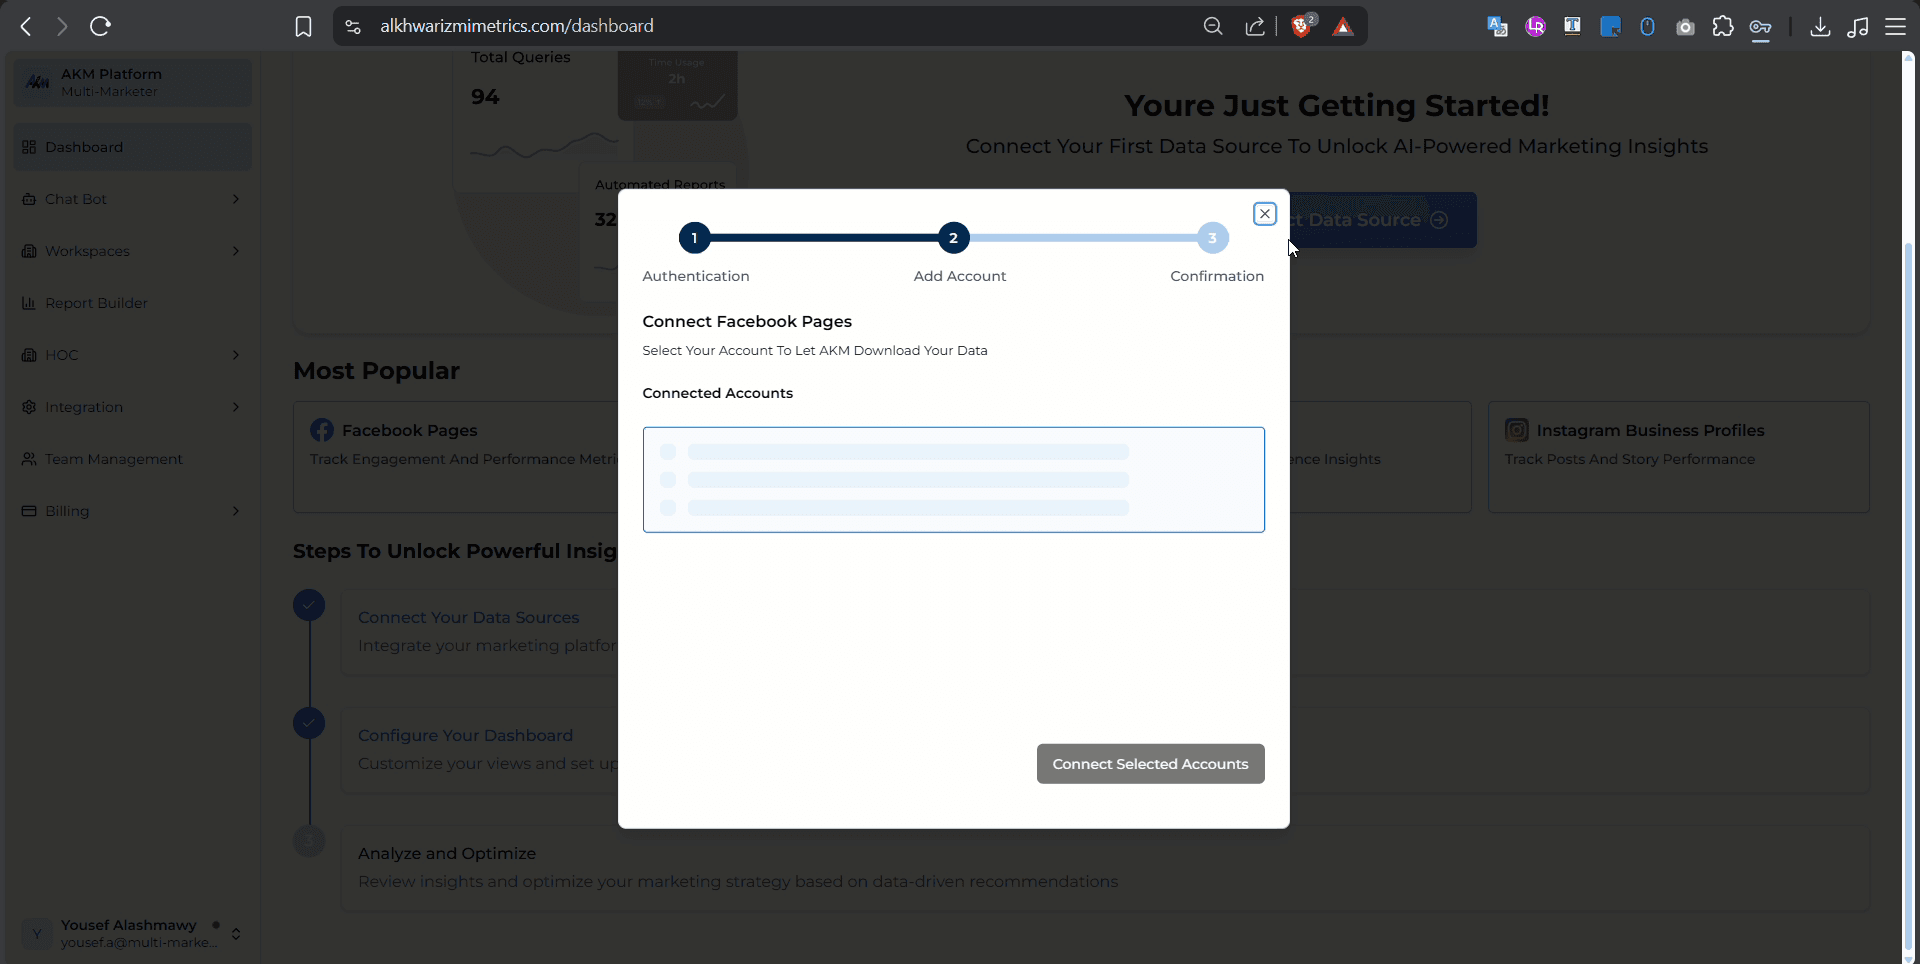
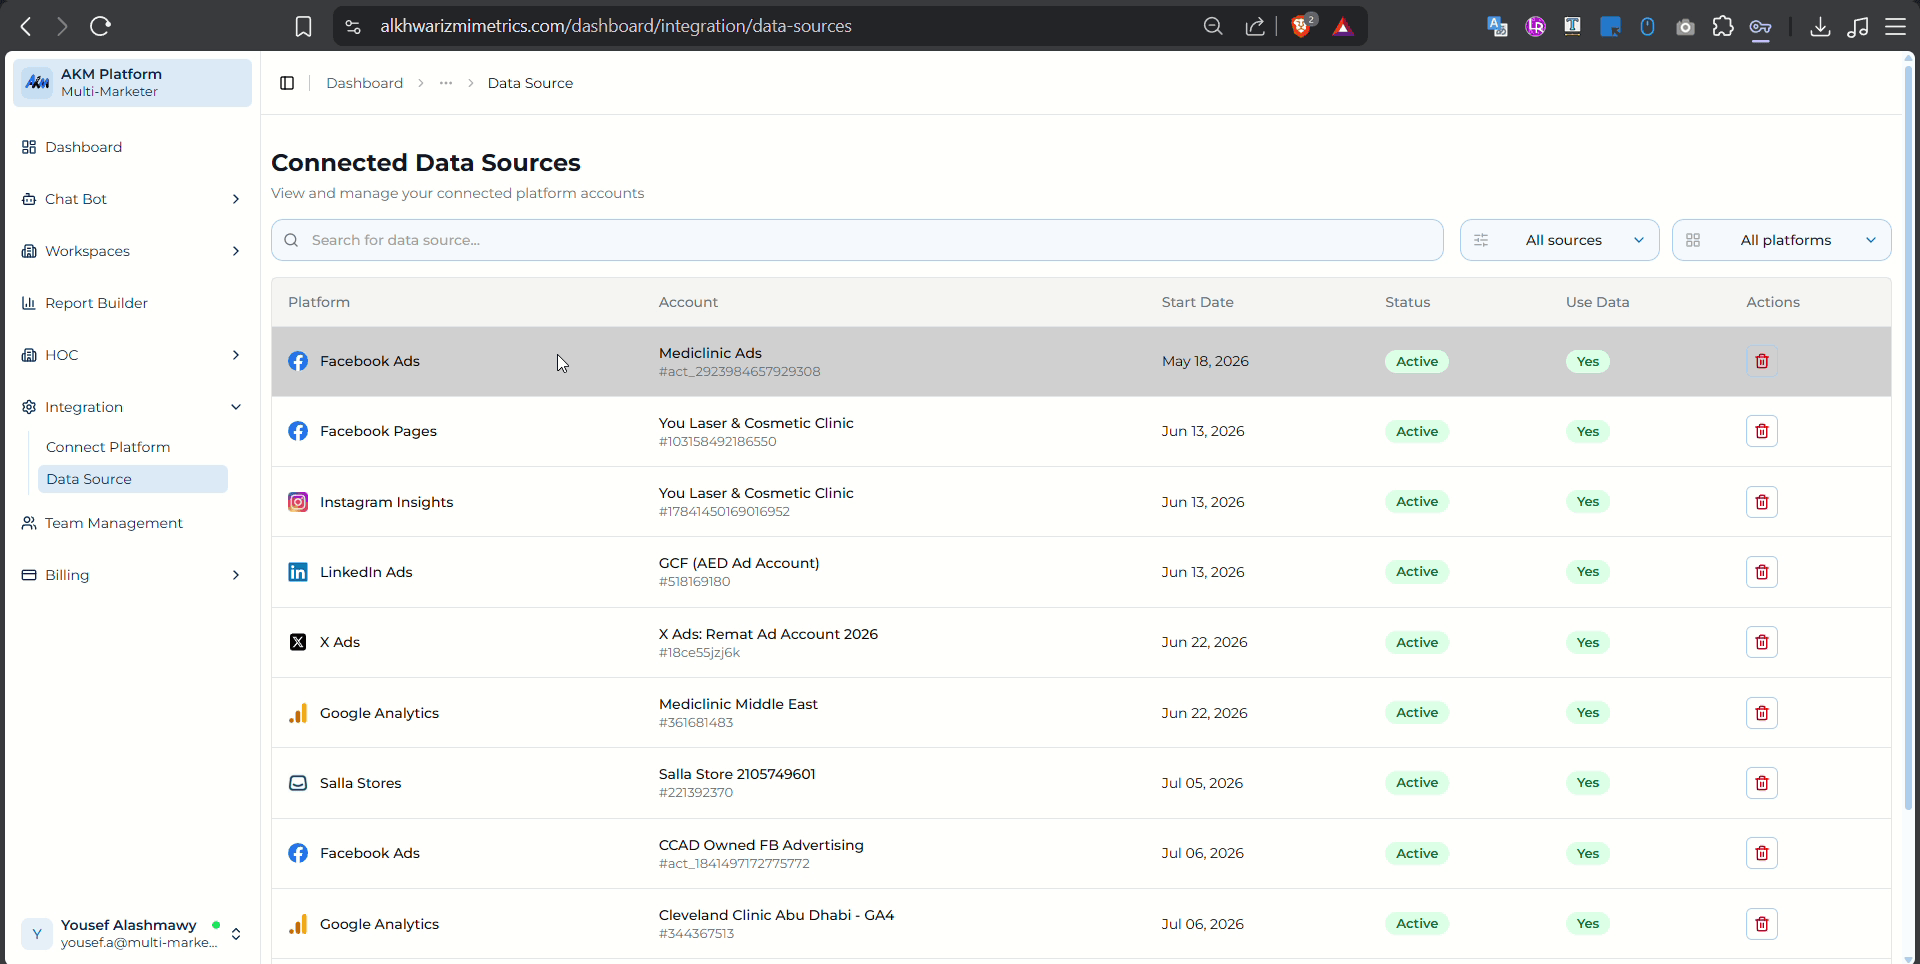
Authenticate an account, select the useful source and confirm it before any report is built.
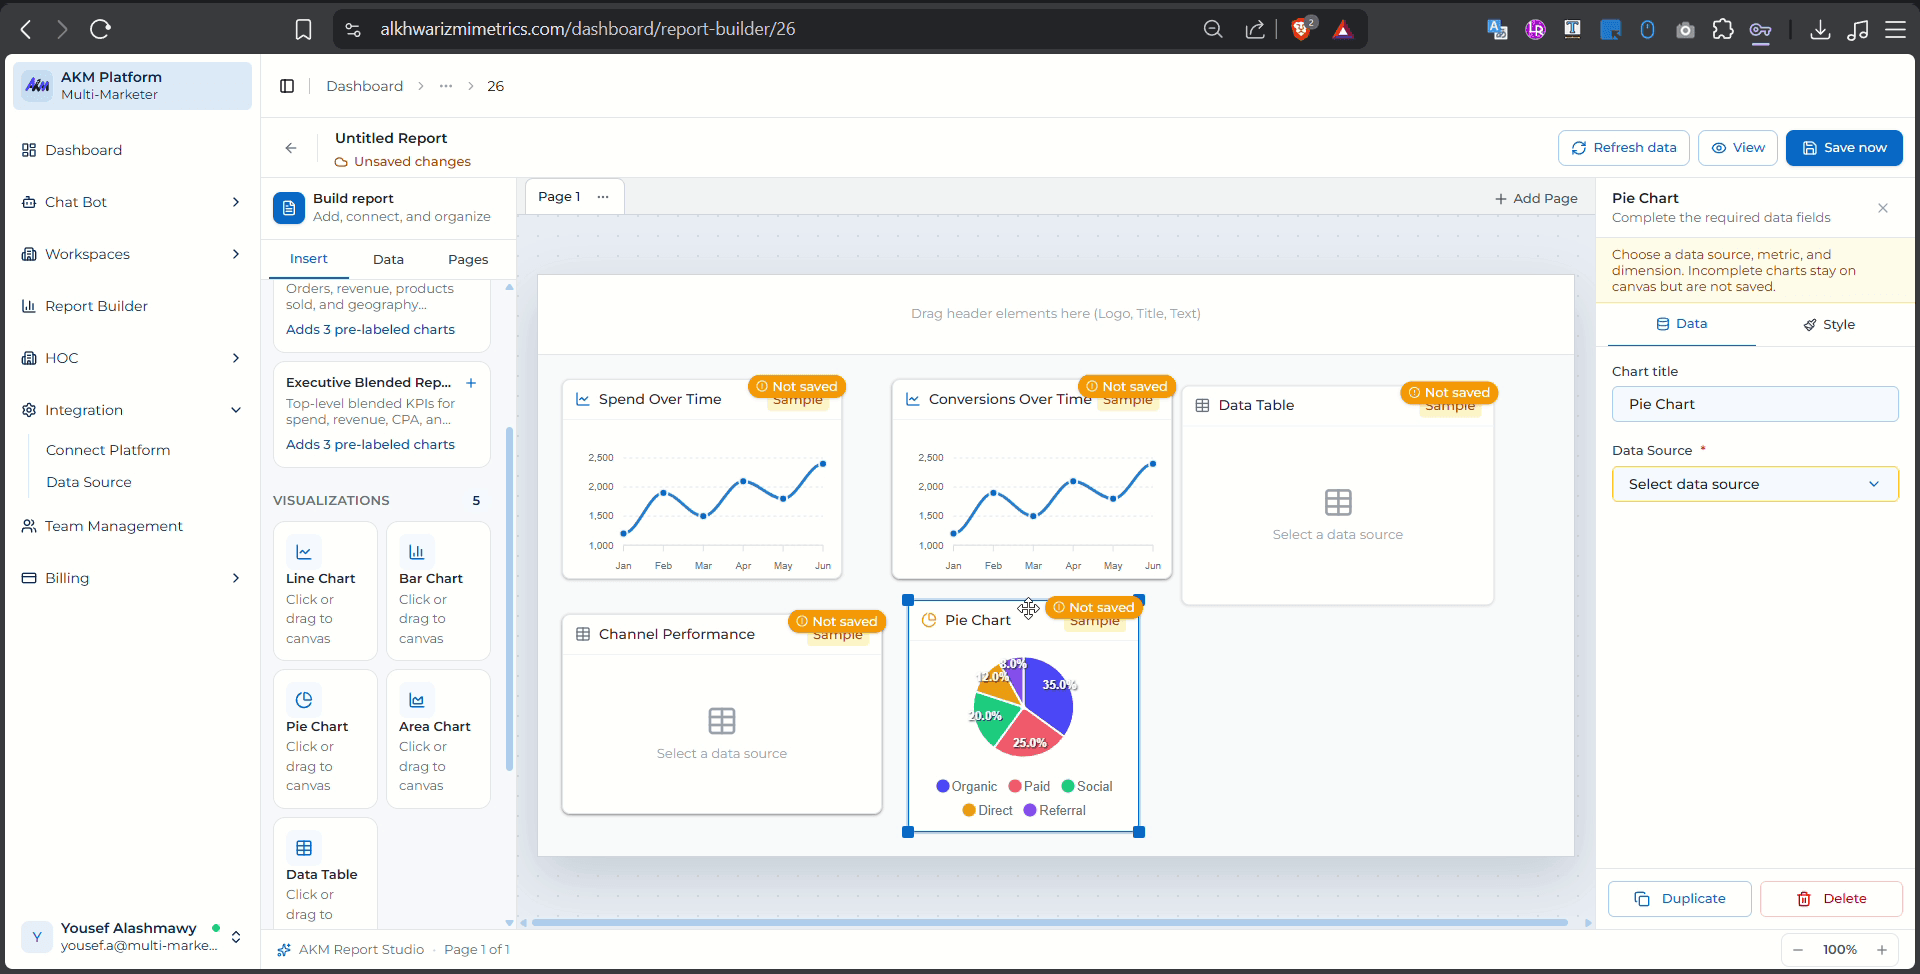
Place charts and tables, choose their data, arrange the canvas and preserve clear save states.
The product
A working layer between raw channels and readable decisions.
Khwarizmi brings connected marketing accounts, source management and report composition into the same product language. The interface has to remain useful while loading, configuring, validating and refreshing live data.
- Role
- Frontend development · Product UI
- Platform
- Responsive web app
- Focus
- Integrations + report builder
- Interface
- Data-dense workspace
The challenge
Flexible enough to build.
Clear enough to trust.
A configurable analytics product carries more than charts. Every connection, field requirement, empty state and save status must make the next action obvious.
Outside systems
Every platform brings different authentication, account and availability states.
Dense configuration
Canvas, library and property controls must coexist without hiding the report itself.
Incomplete data
Widgets need useful guidance before a source, metric or dimension is fully configured.
Integration flow
Connection is treated as a guided product state.
The interface separates authentication, account selection and confirmation so users always know what has happened and what remains.
- 01Choose platform
- 02Authenticate
- 03Select account
- 04Confirm source
Report composition
Three work zones. One continuous canvas.
The builder keeps available visualizations on the left, the report in the center and contextual data or styling controls on the right.
Interface decisions
Configuration stays visible without becoming the product.
Explicit progress
Connection steps and report save states stay labeled, not implied through color alone.
Contextual controls
The inspector changes with the selected widget so the canvas remains focused.
Useful incomplete states
Unconfigured charts explain what is missing and remain editable instead of failing silently.
Stable spatial model
Navigation, tool library, canvas and properties keep predictable homes across the workflow.
Outcome
From disconnected sources to a report users can shape.
The finished experience connects two difficult jobs—data integration and report composition—through one calm, explicit interaction model.
Data connected.
Decisions composed.